ESG & Institutional Investment

Part 7

Henrique C. Martins

About today

This is a lecture about:

  • How does G is associated with E&S?
  • Empirical evidence on ESG

Why this type of lecture is important?

Well, if we don’t understand what works and what don’t, we can never improve.

Also, analyzing data might be the best way to separate the underlying associations from the all the “buzz” that is out there.

About today

library(dplyr)
library(yfR)
library(ggplot2)
library(PerformanceAnalytics)
library(PortfolioAnalytics)
library(tidyquant)
library(ggthemes)
library(tidyr)
library(writexl)
library(readxl)
library(DescTools)
library(ggridges)
esg <- read_excel("esg.xlsx")

Empirical evidence

The source of data is: Refinitiv for the years 2015-2020.

Therefore, our discussion can be affected by their score methodology.

Finally, these are simple stylized facts about the data. We cannot make strong conclusions using these graphs.

There are several question we can try answer with data:

  • First, let’s inspect the data.

ESG

R
library(ggpubr)
g1 <- ggplot(esg, aes(x=`ESG Score`))                   + geom_histogram(binwidth=1) +   theme_solarized()
g2 <- ggplot(esg, aes(x=`Environmental Pillar Score`))  + geom_histogram(binwidth=1) +   theme_solarized()
g3 <- ggplot(esg, aes(x=`Social Pillar Score`))         + geom_histogram(binwidth=1) +   theme_solarized()
g4 <- ggplot(esg, aes(x=`Governance Pillar Score`))     + geom_histogram(binwidth=1) +   theme_solarized()
ggarrange(g1, g2, g3, g4, ncol = 2, nrow = 2)
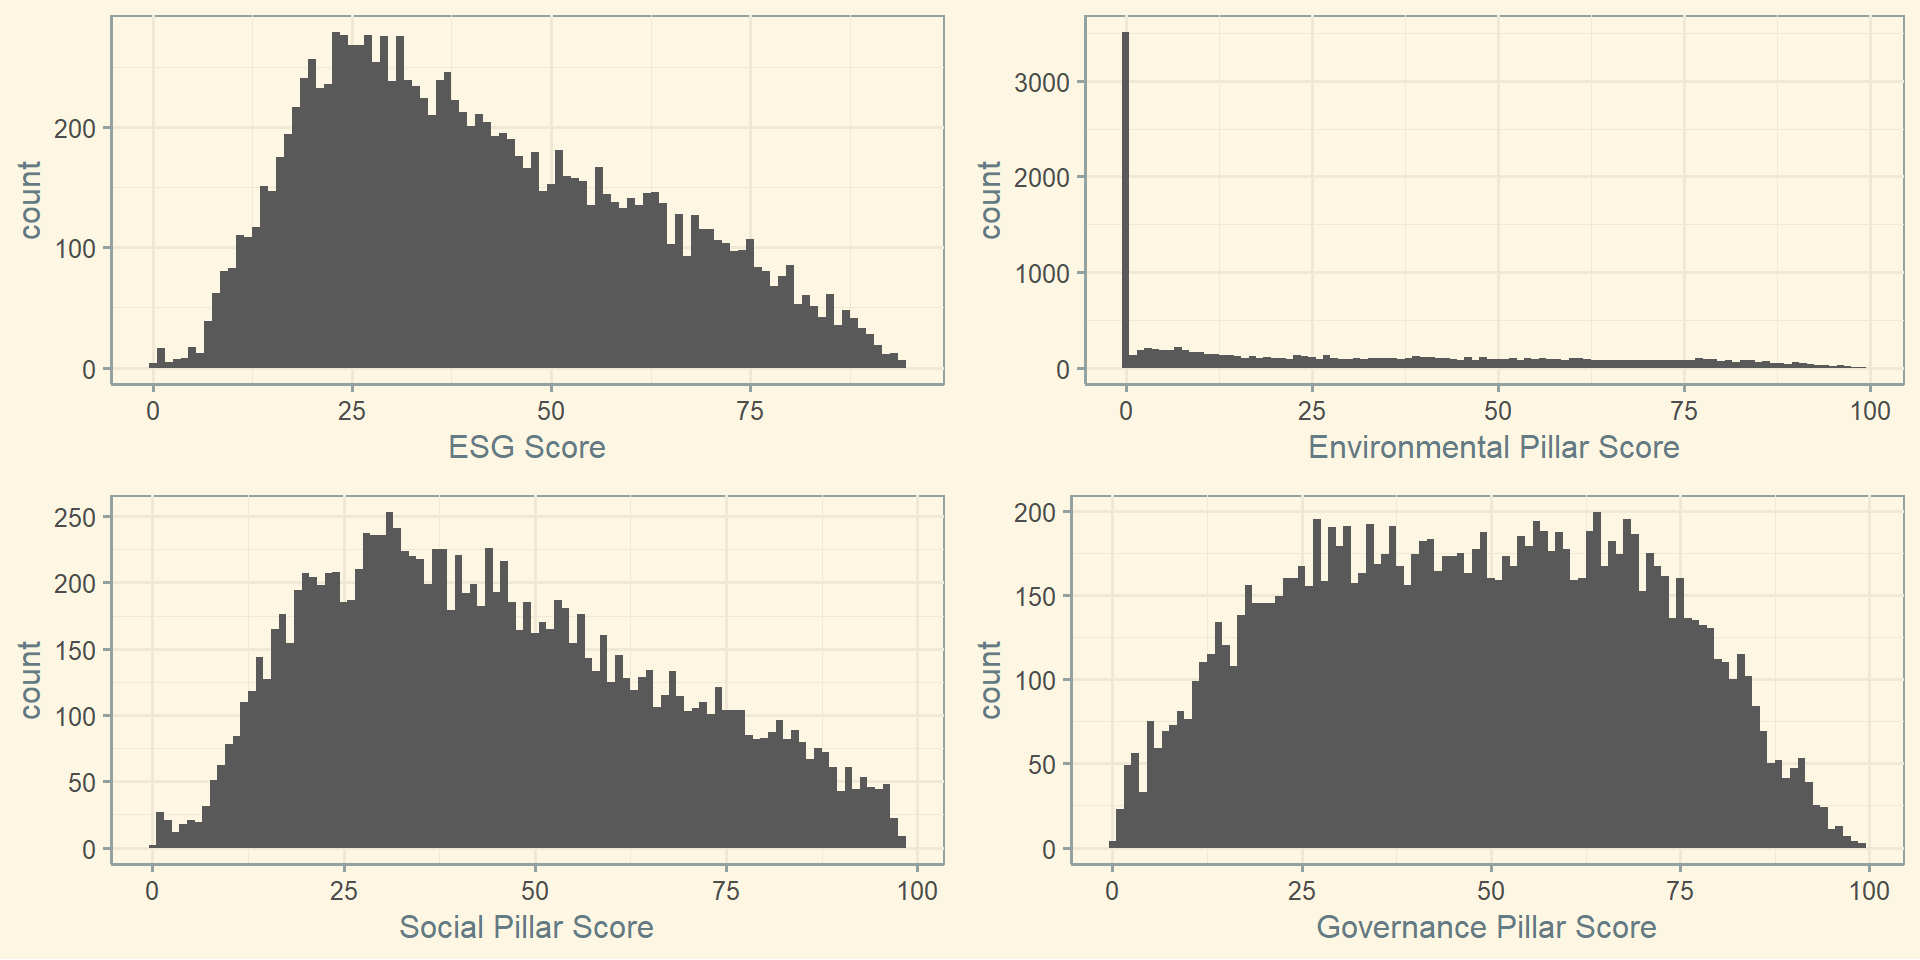
ESG

R
h1<- ggplot(esg, aes(y= `Environmental Pillar Score`, x=`Social Pillar Score`))     + geom_point() + geom_smooth(method=lm, se=FALSE)  +   theme_solarized()
h2<- ggplot(esg, aes(y= `Environmental Pillar Score`, x=`Governance Pillar Score`)) + geom_point() + geom_smooth(method=lm, se=FALSE)  +   theme_solarized()
h3<- ggplot(esg, aes(y= `Social Pillar Score`, x=`Governance Pillar Score`))        + geom_point() + geom_smooth(method=lm, se=FALSE)  +   theme_solarized()
ggarrange(h1, h2, h3, ncol = 2, nrow = 2)

Empirical evidence

There are several question we can try answer with data:

  • Does ESG correlate with Performance?

ESG & Market Value

R
ggplot(esg, aes(x= `ESG Score`, y=MtB)) + geom_point() +
  geom_smooth(method=lm, se=FALSE)  +   theme_solarized()

ESG & Market Value

R
ggplot(esg, aes(x= `ESG Score`, y=Winsorize(MtB, probs = c(0.01, 0.99) ,na.rm = TRUE))) + geom_point() +
  geom_smooth(method=lm, se=FALSE)  +   theme_solarized()

E & Market Value

R
ggplot(esg, aes(x= `Environmental Pillar Score`, y=Winsorize(MtB, probs = c(0.01, 0.99) ,na.rm = TRUE))) + geom_point() +
  geom_smooth(method=lm, se=FALSE)  +   theme_solarized()

S & Market Value

R
ggplot(esg, aes(x= `Social Pillar Score`, y=Winsorize(MtB, probs = c(0.01, 0.99) ,na.rm = TRUE))) + geom_point() +
  geom_smooth(method=lm, se=FALSE)  +   theme_solarized()

G & Market Value

R
ggplot(esg, aes(x= `Governance Pillar Score`, y=Winsorize(MtB, probs = c(0.01, 0.99) ,na.rm = TRUE))) + geom_point() +
  geom_smooth(method=lm, se=FALSE)  +   theme_solarized()

ESG & Market Value

R
summary(lm(esg$MtB  ~esg$`ESG Score`))

Call:
lm(formula = esg$MtB ~ esg$`ESG Score`)

Residuals:
   Min     1Q Median     3Q    Max 
-2.527 -1.209 -0.651  0.330 59.583 

Coefficients:
                 Estimate Std. Error t value Pr(>|t|)    
(Intercept)      2.664010   0.057120   46.64   <2e-16 ***
esg$`ESG Score` -0.019416   0.001228  -15.81   <2e-16 ***
---
Signif. codes:  0 '***' 0.001 '**' 0.01 '*' 0.05 '.' 0.1 ' ' 1

Residual standard error: 2.665 on 11378 degrees of freedom
  (1556 observations deleted due to missingness)
Multiple R-squared:  0.0215,    Adjusted R-squared:  0.02142 
F-statistic: 250.1 on 1 and 11378 DF,  p-value: < 2.2e-16

ESG & ROA

R
ggplot(esg, aes(x= `ESG Score`, y= ROA)) + geom_point() +
  geom_smooth(method=lm, se=FALSE)  +   theme_solarized()

ESG & ROA

R
ggplot(esg, aes(x= `ESG Score`, y=Winsorize(ROA, probs = c(0.01, 0.99) ,na.rm = TRUE))) + geom_point() +
  geom_smooth(method=lm, se=FALSE)  +   theme_solarized()

E & ROA

R
ggplot(esg, aes(x= `Environmental Pillar Score`, y=Winsorize(ROA, probs = c(0.01, 0.99) ,na.rm = TRUE))) + geom_point() +
  geom_smooth(method=lm, se=FALSE)  +   theme_solarized()

S & ROA

R
ggplot(esg, aes(x= `Social Pillar Score`, y=Winsorize(ROA, probs = c(0.01, 0.99) ,na.rm = TRUE))) + geom_point() +
  geom_smooth(method=lm, se=FALSE)  +   theme_solarized()

G & ROA

R
ggplot(esg, aes(x= `Governance Pillar Score`, y=Winsorize(ROA, probs = c(0.01, 0.99) ,na.rm = TRUE))) + geom_point() +
  geom_smooth(method=lm, se=FALSE)  +   theme_solarized()

Empirical evidence

There are several question we can try answer with data:

  • Are ESG firms trying to innovate?

ESG & Research & Development invest.

R
ggplot(esg, aes(x= `ESG Score`, y=Winsorize(`R&D`, probs = c(0.01, 0.99) ,na.rm = TRUE))) + geom_point() +
  geom_smooth(method=lm, se=FALSE)  +   theme_solarized()

E & Research & Development invest.

R
ggplot(esg, aes(x= `Environmental Pillar Score`, y=Winsorize(`R&D`, probs = c(0.01, 0.99) ,na.rm = TRUE))) + geom_point() +
  geom_smooth(method=lm, se=FALSE)  +   theme_solarized()

S & Research & Development invest.

R
ggplot(esg, aes(x= `Social Pillar Score`, y=Winsorize(`R&D`, probs = c(0.01, 0.99) ,na.rm = TRUE))) + geom_point() +
  geom_smooth(method=lm, se=FALSE)  +   theme_solarized()

G & Research & Development invest.

R
ggplot(esg, aes(x= `Governance Pillar Score`, y=Winsorize(`R&D`, probs = c(0.01, 0.99) ,na.rm = TRUE))) + geom_point() +
  geom_smooth(method=lm, se=FALSE)  +   theme_solarized()

Empirical evidence

There are several question we can try answer with data:

  • Which of these selected countries is doing better?

ESG by country

R
esg_avg <- esg %>%
  group_by(`Country of Incorporation`) %>%
  summarise_at(vars(`ESG Score`), list(mean = mean))

ggplot(data=esg_avg, aes(y=mean , x=`Country of Incorporation`)) +
  geom_bar(stat="identity") +   theme_solarized()

ESG by country

R
ggplot(esg, aes(x = `ESG Score`, y = `Country of Incorporation`, fill = `Country of Incorporation`)) +
  geom_density_ridges() +
  theme_solarized() 

E by country

R
ggplot(esg, aes(x = `Environmental Pillar Score`, y = `Country of Incorporation`, fill = `Country of Incorporation`)) +
  geom_density_ridges() +
  theme_solarized() 

S by country

R
ggplot(esg, aes(x = `Social Pillar Score`, y = `Country of Incorporation`, fill = `Country of Incorporation`)) +
  geom_density_ridges() +
  theme_solarized() 

G by country

R
ggplot(esg, aes(x = `Governance Pillar Score`, y = `Country of Incorporation`, fill = `Country of Incorporation`)) +
  geom_density_ridges() +
  theme_solarized() 

R
e_avg <- esg %>%
  group_by(`Country of Incorporation`) %>%
  summarise_at(vars(`Environmental Pillar Score`), list(mean = mean))
ggplot(data=e_avg, aes(y=mean , x=`Country of Incorporation`)) +
  geom_bar(stat="identity") +   theme_solarized()

R
s_avg <- esg %>%
  group_by(`Country of Incorporation`) %>%
  summarise_at(vars(`Social Pillar Score`), list(mean = mean))
ggplot(data=s_avg, aes(y=mean , x=`Country of Incorporation`)) +
  geom_bar(stat="identity") +   theme_solarized()

R
g_avg <- esg %>%
  group_by(`Country of Incorporation`) %>%
  summarise_at(vars(`Governance Pillar Score`), list(mean = mean))
ggplot(data=g_avg, aes(y=mean , x=`Country of Incorporation`)) +
  geom_bar(stat="identity") +   theme_solarized()

Empirical evidence

There are several question we can try answer with data:

  • Is ESG “improving” over time?

“Improving” as measured by the Score.

ESG by year

R
esg_avg_year <- esg %>%
  group_by(`year`) %>%
  summarise_at(vars(`ESG Score`), list(mean = mean))
ggplot(data=esg_avg_year, aes(y=mean , x=`year`)) +
  geom_line() +   theme_solarized()

E by year

R
e_avg_year <- esg %>%
  group_by(`year`) %>%
  summarise_at(vars(`Environmental Pillar Score`), list(mean = mean))
ggplot(data=e_avg_year, aes(y=mean , x=`year`)) +
  geom_line() +   theme_solarized()

S by year

R
s_avg_year <- esg %>%
  group_by(`year`) %>%
  summarise_at(vars(`Social Pillar Score`), list(mean = mean))
ggplot(data=s_avg_year, aes(y=mean , x=`year`)) +
  geom_line() +   theme_solarized()

G by year

R
g_avg_year <- esg %>%
  group_by(`year`) %>%
  summarise_at(vars(`Governance Pillar Score`), list(mean = mean))
ggplot(data=g_avg_year, aes(y=mean , x=`year`)) +
  geom_line() +   theme_solarized()

Empirical evidence Boards

There are several question we can try answer with data:

  • Does Board characteristics correlate with ESG?

Board Diversity & ESG

R
ggplot(esg, aes(y= `ESG Score`, x=`Female on Board`)) + geom_point() +
  geom_smooth(method=lm, se=FALSE)  +   theme_solarized()

Board Diversity & E

R
ggplot(esg, aes(y= `Environmental Pillar Score`, x=`Female on Board`)) + geom_point() +
  geom_smooth(method=lm, se=FALSE)  +   theme_solarized()

Board Diversity & S

R
ggplot(esg, aes(y= `Social Pillar Score`, x=`Female on Board`)) + geom_point() +
  geom_smooth(method=lm, se=FALSE)  +   theme_solarized()

Board Diversity & G

R
ggplot(esg, aes(y= `Governance Pillar Score`, x=`Female on Board`)) + geom_point() +
  geom_smooth(method=lm, se=FALSE)  +   theme_solarized()

Board Independence & ESG

R
ggplot(esg, aes(y= `ESG Score`, x=`Independent Board Members`)) + geom_point() +
  geom_smooth(method=lm, se=FALSE)  +   theme_solarized()

Board Independence & E

R
ggplot(esg, aes(y= `Environmental Pillar Score`, x=`Independent Board Members`)) + geom_point() +
  geom_smooth(method=lm, se=FALSE)  +   theme_solarized()

Board Independence & S

R
ggplot(esg, aes(y= `Social Pillar Score`, x=`Independent Board Members`)) + geom_point() +
  geom_smooth(method=lm, se=FALSE)  +   theme_solarized()

Board Independence & G

R
ggplot(esg, aes(y= `Governance Pillar Score`, x=`Independent Board Members`)) + geom_point() +
  geom_smooth(method=lm, se=FALSE)  +   theme_solarized()

Board Tenure & ESG

R
ggplot(esg, aes(y= `ESG Score`, x=`Average Board Tenure`)) + geom_point() +
  geom_smooth(method=lm, se=FALSE)  +   theme_solarized()

Board Tenure & E

R
ggplot(esg, aes(y= `Environmental Pillar Score`, x=`Average Board Tenure`)) + geom_point() +
  geom_smooth(method=lm, se=FALSE)  +   theme_solarized()

Board Tenure & S

R
ggplot(esg, aes(y= `Social Pillar Score`, x=`Average Board Tenure`)) + geom_point() +
  geom_smooth(method=lm, se=FALSE)  +   theme_solarized()

Board Tenure & G

R
ggplot(esg, aes(y= `Governance Pillar Score`, x=`Average Board Tenure`)) + geom_point() +
  geom_smooth(method=lm, se=FALSE)  +   theme_solarized()

Owner & ESG

R
esg_owners <- subset(esg,`Investor Type Description` != "NA")
esg_owners <- subset(esg,`Investor Type Description` != "Insurance Company")


ggplot(esg_owners , aes(x = `ESG Score`, y = `Investor Type Description`, fill = `Investor Type Description`)) + geom_density_ridges() +   theme_solarized() 

Owner & E

R
ggplot(esg_owners , aes(x = `Environmental Pillar Score`, y = `Investor Type Description`, fill = `Investor Type Description`)) + geom_density_ridges() +   theme_solarized() 

Owner & S

R
ggplot(esg_owners , aes(x = `Social Pillar Score`, y = `Investor Type Description`, fill = `Investor Type Description`)) + geom_density_ridges() +   theme_solarized() 

Owner & g

R
ggplot(esg_owners , aes(x = `Governance Pillar Score`, y = `Investor Type Description`, fill = `Investor Type Description`)) + geom_density_ridges() +   theme_solarized() 

Ownership Concentration & ESG

R
ggplot(esg, aes(y= `ESG Score`, x=`Holdings Pct Of Traded Shares Held`)) + geom_point() +
  geom_smooth(method=lm, se=FALSE)  +   theme_solarized()

Ownership Concentration & E

R
ggplot(esg, aes(y= `Environmental Pillar Score`, x=`Holdings Pct Of Traded Shares Held`)) + geom_point() +
  geom_smooth(method=lm, se=FALSE)  +   theme_solarized()

Ownership Concentration & S

R
ggplot(esg, aes(y= `Social Pillar Score`, x=`Holdings Pct Of Traded Shares Held`)) + geom_point() +
  geom_smooth(method=lm, se=FALSE)  +   theme_solarized()

Ownership Concentration & G

R
ggplot(esg, aes(y= `Governance Pillar Score`, x=`Holdings Pct Of Traded Shares Held`)) + geom_point() +
  geom_smooth(method=lm, se=FALSE)  +   theme_solarized()

Empirical evidence industries

There are several question we can try answer with data:

  • Finally, what about industries?

ESG by Industry

R
esg_avg <- esg %>%
  group_by(`NAICS Sector Name`) %>%
  summarise_at(vars(`ESG Score`), list(mean = mean))

ggplot(data=esg_avg, aes(y=mean , x=`NAICS Sector Name`)) +
  geom_bar(stat="identity") +   theme_solarized() 

ESG by Industry

R
esg_avg
# A tibble: 18 × 2
   `NAICS Sector Name`                                                      mean
   <chr>                                                                   <dbl>
 1 Accommodation and Food Services                                          44.8
 2 Administrative and Support and Waste Management and Remediation Servic…  41.9
 3 Agriculture, Forestry, Fishing and Hunting                               36.0
 4 Arts, Entertainment, and Recreation                                      29.6
 5 Construction                                                             40.6
 6 Educational Services                                                     35.3
 7 Finance and Insurance                                                    35.8
 8 Health Care and Social Assistance                                        39.5
 9 Information                                                              37.7
10 Manufacturing                                                            43.3
11 Mining, Quarrying, and Oil and Gas Extraction                            39.0
12 Other Services (except Public Administration)                            32.3
13 Professional, Scientific, and Technical Services                         35.4
14 Real Estate and Rental and Leasing                                       41.0
15 Retail Trade                                                             46.3
16 Transportation and Warehousing                                           43.8
17 Utilities                                                                49.3
18 Wholesale Trade                                                          38.4

I hope you like this class!

Find me at:

henrique.martins@fgv.br

https://eaesp.fgv.br/en/people/henrique-castro-martins

henriquemartins.net

https://www.linkedin.com/in/henriquecastror/